Telehealth Ad Performance Metrics That Actually Matter
Which metrics to track, which to ignore, and how to measure telehealth paid social performance. CPA, ROAS, LTV, and cohort analysis from $50M+ managed spend.
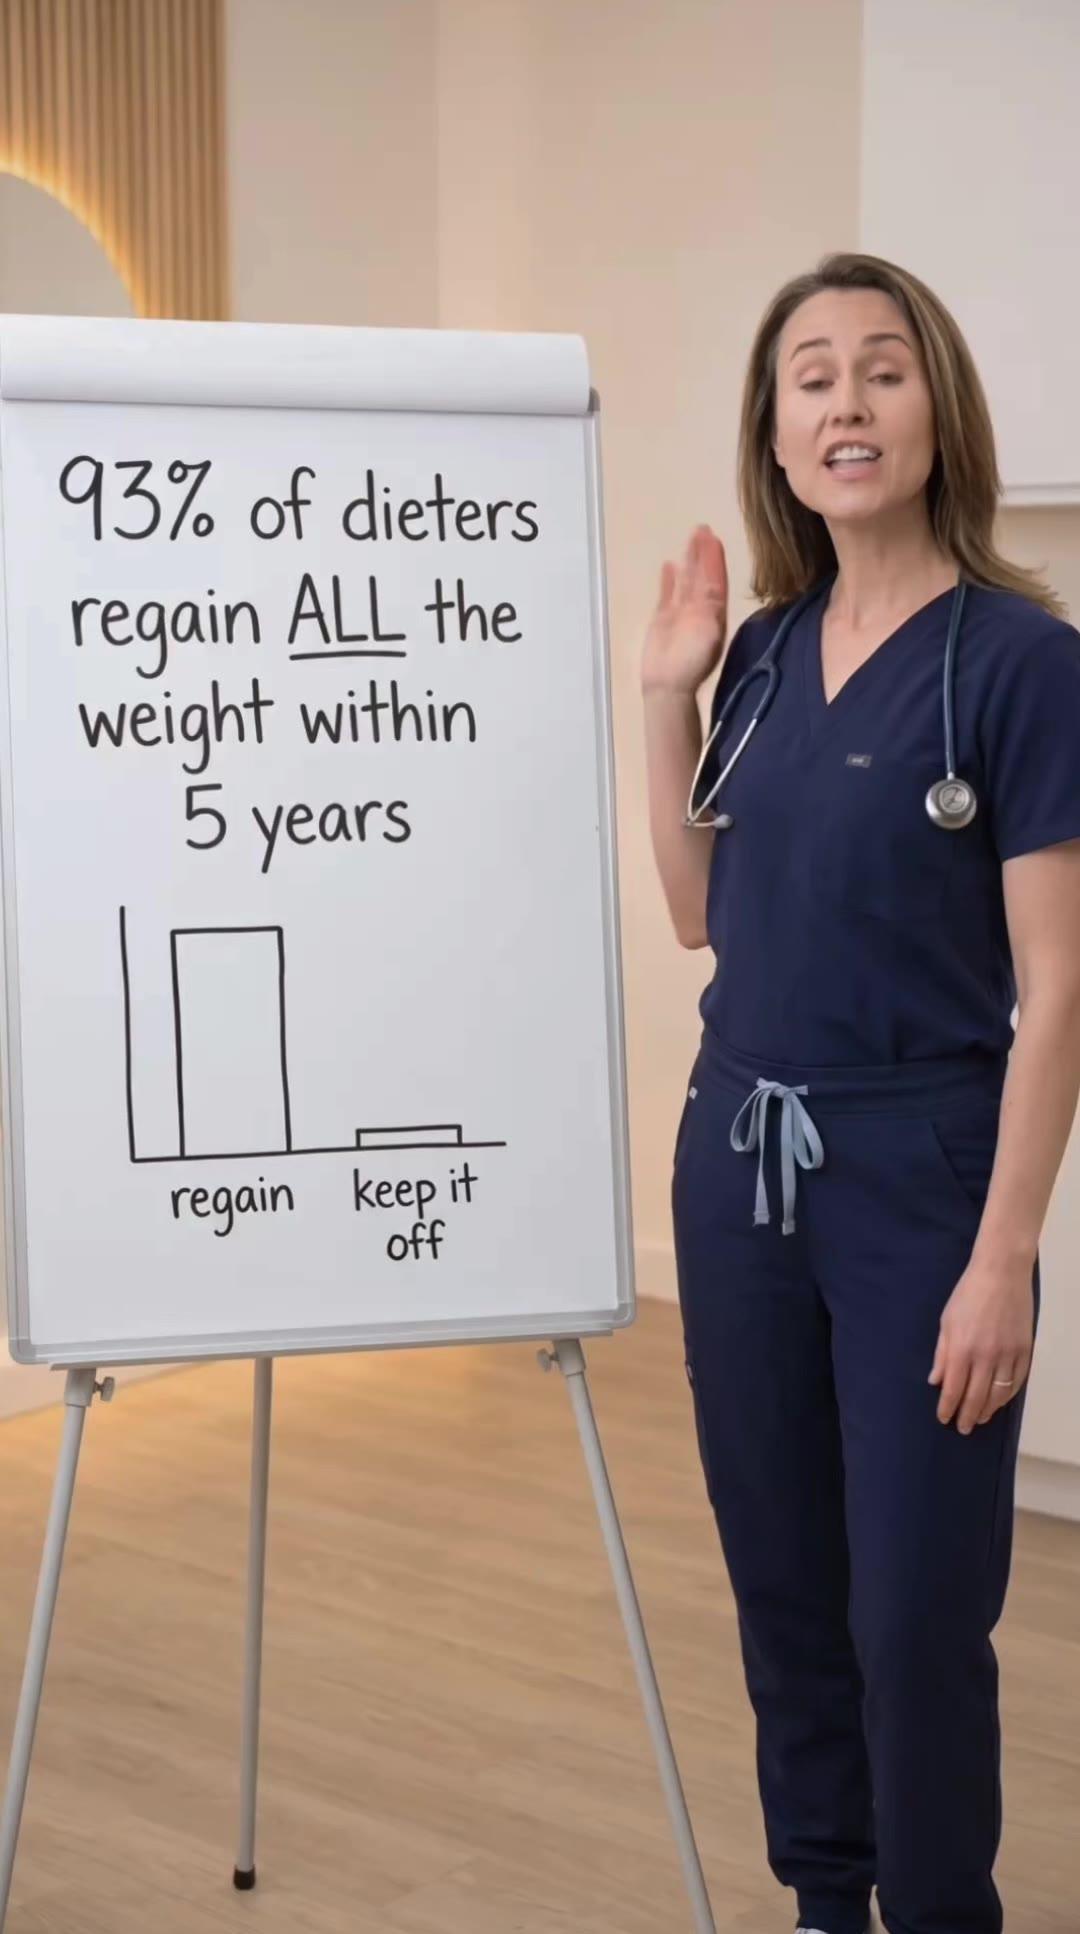
Concepts shown are internal creative studies, not client campaigns.


CTR does not matter. Impressions do not matter. Reach does not matter. After managing $50M+ in telehealth paid social spend, the metrics that determine success are CPA, customer LTV, payback period, and retention rate. Everything else is vanity metrics that look impressive in reports but don't predict profitability.
CPA — Cost Per Acquisition, Not Cost Per Lead
Track CPA as cost per paying customer, not cost per consultation or cost per lead. Many telehealth brands optimize for consultation bookings and wonder why they're unprofitable. Consultations that don't convert to purchases are worthless. Optimize for revenue-generating customers, not calendar bookings.
Segment CPA by channel, campaign, and audience type. Blended CPA across all traffic sources hides performance problems. Cold prospecting CPAs should be 40-60% higher than retargeting CPAs. If they're not, your retargeting segmentation is broken. For retargeting structure, review telehealth retargeting on Facebook.
Track CPA trends weekly, not daily. Daily CPA fluctuations are noise. Weekly trends show whether performance is improving, stable, or degrading. If weekly CPA increases 20%+ for three consecutive weeks, you have creative fatigue, audience saturation, or funnel problems. Fix root cause before adding more budget.
Customer Lifetime Value — The Only Metric That Matters Long-Term
LTV determines whether your business is viable, not whether your ads are good. GLP-1 brands with $180 first-purchase CPA and $800 12-month LTV are profitable. ED brands with $70 CPA and $200 6-month LTV are unprofitable. CPA in isolation is meaningless without LTV context.
Calculate LTV by cohort, not as a single number. January 2026 customer cohort has different LTV than May 2026 cohort if you changed pricing, product offering, or customer qualification. Cohort analysis reveals whether recent changes improve or destroy unit economics.
Track LTV at 30, 90, 180, and 365 days. Most telehealth brands need 180-day LTV data to determine profitability. First-month LTV is almost always negative. Six-month LTV determines whether you can scale sustainably. Twelve-month LTV shows maximum customer value, but most brands cannot wait 12 months to assess ad performance.
Payback Period — How Fast You Recover CAC
Payback period is the number of months until gross profit from a customer exceeds acquisition cost. GLP-1 brands typically see 4-8 month payback. TRT is 3-6 months. ED is 2-5 months. Hair loss is 4-7 months. These ranges determine how much capital you need to scale.
Brands with 6+ month payback periods need significant capital reserves to scale. If you're acquiring 1,000 customers per month at $200 CPA with 6-month payback, you need $1.2M working capital to fund six months of negative cash flow. Undercapitalized brands cannot scale profitably regardless of ad performance.
Shorten payback period by improving retention (more months of revenue per customer), increasing pricing (more revenue per month), or reducing CPA (less upfront cost). Most brands focus only on reducing CPA, but retention and pricing improvements have 2-3× larger impact on payback period.
Concepts we ship across every awareness stage.
See the work →Retention Rate — The Metric Most Brands Ignore
Track retention at month 1, 3, 6, and 12. Month 1 retention (percentage of first-time buyers who purchase a second time) predicts long-term retention better than any other early signal. If month 1 retention is under 60%, you have product, pricing, or fulfillment problems. Ads cannot fix this.
Month 3 retention is the first indicator of sustainable business. GLP-1 brands should see 70%+ retention at month 3. TRT should be 75%+. ED struggles at 50-65% because customers switch providers for small price differences. Hair loss should be 70-80% because treatment requires 6-month commitment to see results.
Segment retention by acquisition channel. Customers from retargeting campaigns typically have 10-20% higher retention than cold prospecting customers. Customers from educational creative have 10-15% higher retention than testimonial-driven customers. Optimizing for high-retention customer segments improves LTV more than optimizing for low CPA.
ROAS — When It's Useful and When It's Not
First-month ROAS is useless for GLP-1 and TRT. These verticals lose money on first purchase. If you optimize for first-month ROAS, you starve growth. Track 6-month or 12-month ROAS instead, which includes retention revenue and shows true profitability.
ROAS works for ED and low-price products where customers break even or profit on first purchase. If your product is $30-60/month with high immediate conversion, first-month ROAS is a valid optimization metric. For higher-ticket or subscription-based models, ROAS creates false optimization signals.
Use ROAS for campaign comparison, not absolute performance assessment. If Campaign A delivers 0.6× first-month ROAS and Campaign B delivers 0.4×, Campaign A is better even though both are "negative." ROAS ranks campaign effectiveness when LTV data is unavailable, but never replace LTV tracking with ROAS.
Metrics to Ignore (or De-Prioritize)
CTR (click-through rate) does not predict conversion performance. High CTR with low landing page conversion rate means your ad messaging misrepresents your offer. Low CTR with high conversion rate means you're attracting high-intent traffic. Optimize for CPA, not CTR.
Impressions and reach are vanity metrics. Showing ads to 1M people means nothing if 10 convert. These metrics matter for brand awareness campaigns but telehealth paid social is direct response. Conversion volume and CPA determine success, not how many people saw your ad.
Cost per click (CPC) is a lagging indicator, not a leading indicator. High CPC due to expensive, high-converting traffic is good. Low CPC from cheap, low-converting traffic is bad. Never optimize for CPC unless you're running a traffic arbitrage model, which doesn't work for prescription drug advertising.
Video watch time and completion rate matter only for retargeting audience building. If 75% of viewers watch 50%+ of your video, you're building a large, high-intent retargeting pool. But completion rate doesn't correlate with conversion rate. A 30-second ad with 60% completion can outperform a 15-second ad with 80% completion if the 30-second ad delivers better qualified traffic.
Cohort Analysis — How to Track Performance Over Time
Build monthly cohort reports showing: acquisition month, CPA, month 1/3/6/12 retention, LTV at each interval, and payback period. This single report reveals whether performance is improving, stable, or degrading over time.
Compare cohorts to identify trend changes. If January cohort has 75% month-3 retention but May cohort has 60%, something changed (pricing, qualification, product quality, customer messaging). Investigate immediately. Declining retention destroys profitability faster than rising CPA.
Use cohort data to set target CPAs. If your 6-month LTV is $600 and you need 3:1 LTV:CAC ratio for profitability, your maximum CPA is $200. Cohort analysis grounds CPA targets in business reality rather than arbitrary performance goals. For context on expected performance, see telehealth paid social benchmarks.
Attribution and Tracking Setup
Use Meta Pixel + Conversions API (CAPI) for all conversion tracking. Pixel-only tracking undercounts conversions by 20-40% due to iOS 14.5+ restrictions. CAPI sends server-side conversion data, capturing purchases that Pixel misses.
Set attribution window to 7-day click. Most telehealth purchases happen within 7 days of ad click. Extending to 28-day attribution overcredits ads for organic conversions. Shortening to 1-day attribution undercredits ads for considered purchases. Seven days balances accuracy for prescription drug purchase timelines.
Track on-site events separately from purchase events. Monitor "Add to Cart", "Initiate Checkout", and "Consultation Start" events to identify funnel drop-off points. If consultation starts are high but purchases are low, the problem is medical qualification or pricing communication, not ad traffic quality.
Reporting Frequency and Stakeholder Communication
Report weekly on CPA, conversion volume, and spend. Weekly cadence is sufficient for tactical optimization decisions. Daily reporting creates false urgency around normal performance variance.
Report monthly on LTV, retention, and payback period. These metrics require 30+ days of data to be meaningful. Monthly cohort reports show strategic performance trends that guide budget allocation and channel expansion decisions.
Report quarterly on channel performance and competitive positioning. Quarterly reviews assess whether Meta, TikTok, Search, or other channels deserve budget increases or cuts. This is when you decide to expand to new platforms or double down on proven channels. For channel decisions, reference scaling telehealth ad spend.
Related Articles
Telehealth Facebook Ad Examples: What Actually Works in 2026
Real GLP-1, TRT, ED, and hair loss Facebook ads that convert. Breakdown of winning hooks, formats, and creative strategies from $50M+ managed spend.
Telehealth Subscription vs. One-Time Purchase Ads: Different Strategies
How to structure paid social for subscription telehealth vs. one-time purchases. Messaging, CPA targets, and LTV considerations from $50M+ managed spend.
Telehealth vs. Pharma Paid Social: Key Differences in Strategy
How telehealth DTC advertising differs from traditional pharma paid social. Compliance, creative, and audience strategy from $50M+ managed spend.
Best Ad Formats for Telehealth: UGC, Doctor Interviews, and Educational
Which ad formats work best for GLP-1, TRT, ED, and hair loss paid social. Format performance breakdown and when to use each type from $50M+ managed spend.
Ready to build a testing system that scales?
A 30-minute call. We audit your creative approach and show you exactly what a complete angle-format-hook system looks like for your vertical.